There are a few blogs out there on the internet that walk you through setting up a pfSense Splunk forwarder, and a few more that talk about getting your Suricata IDS logs into your Splunk, but there is not an all-in-one guide to help you do both. Today we hope to solve that problem and give you an all-in-one guide on how to do this.
For those who don’t know what pfSense is, it’s an open source router software based on FreeBSD that can be run on anything from an old desktop tower to a brand new 1U server or virtual machine. The project originally started in 2004 as a fork of a project called “m0n0wall,” and it has been growing in popularity as one of the favorite home and business router operating systems. If you aren’t familiar with the project and would like to give it a try, I recommend heading to pfSense’s website to download the current version and install it in a dev environment.
Suricata is an open source IDS project to help detect and stop network attacks based off of predefined rules or rules that you wrote yourself! Luckily, there is a pfSense package available for you to download and easily configure to stop malicious traffic from accessing your network.
Note: The following steps were written around the latest pfSense 2.4.5-release; future updates may cause this guide to be out-of-date.
Step 1: pfSense SSH Setup
The first thing you’ll need to do is log into your pfSense web GUI and go to System > Advanced to enable secure shell access to your router if you have not done so. This will be needed for future steps.
Best practice here would be to set up access with a public key and password but for sake of demonstration, we’re simply going to enable password authentication at this time.
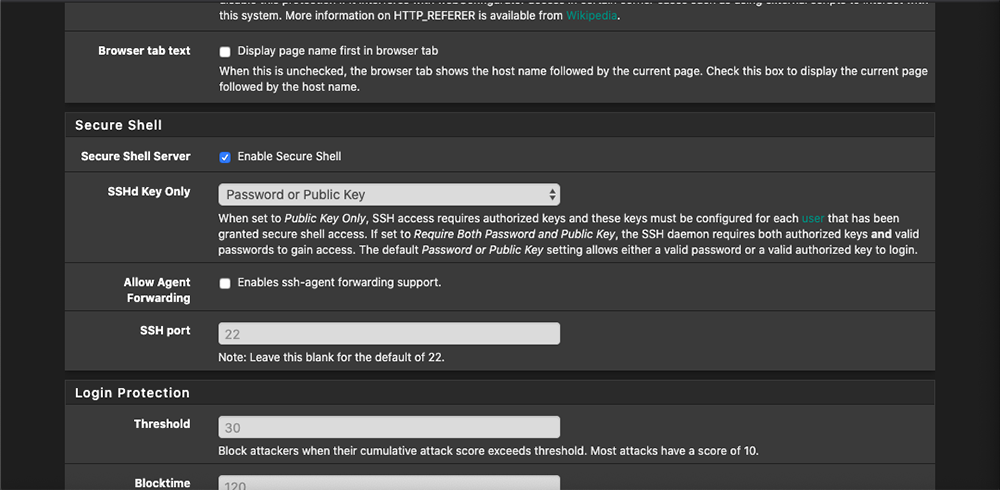
Once you have enabled SSH in the web GUI, verify that you can ssh to the router by using PuTTY, PowerShell, or your favorite terminal environment. “ssh root@ip-of-router”. The password would be the same password you use to authenticate to the web GUI.
Step 2: pfSense Suricata Install
To install Suricata, it’s as simple as clicking a few buttons. We will need to go to System > Package Manager > Available Packages. Scroll down until you find “Suricata” and then click install. We will come back to configuring Suricata later in the tutorial.
Step 3: Splunk Setup
Splunk Index Setup
Before we get any further, we need to configure Splunk to receive our data.
To make things simple, we are going to create two indexes. One for pfSense called “network,” and another for Suricata called “ids.” I recommend you create and keep a table of indexes handy so you know where to look for your data within Splunk. This will solve future headaches when you’re looking for certain events.
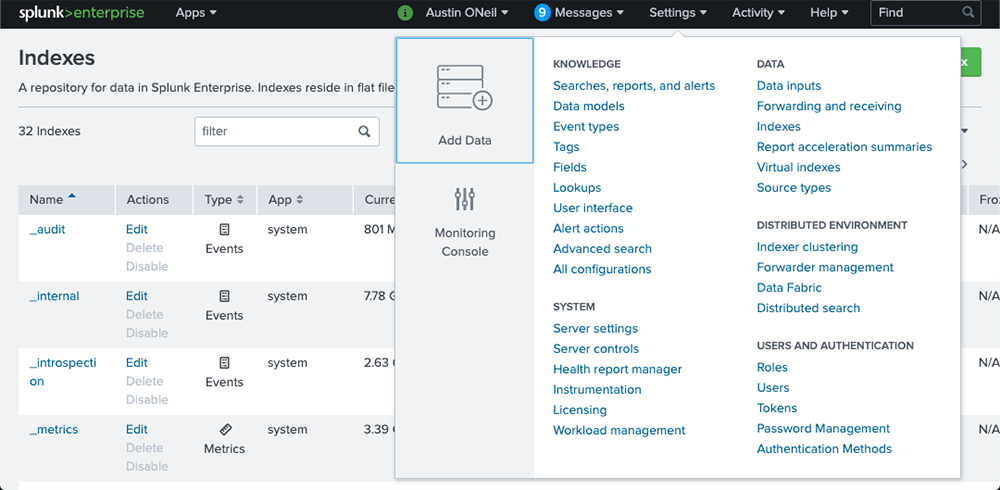
1.) To create an index, log into Splunk and then click Settings > Indexes.
2.) Once on the “Indexes” page, we will want to click “New Index” in the top right corner of the page. You will then be presented with options for creating a new index.
3.) For the first index, we will name it “network.” You can leave the rest of the settings alone unless you want to set up index retention which can be learned about here.
4.) Once finished, go ahead and save the index.
Repeat this process for the other index needed called “ids”.

Splunk Apps Installation
Next, we need to download a few of the Splunk apps from splunkbase.splunk.com
The following links will take you to the apps we will be using in this tutorial:
- Splunk Common Information Model (CIM) – “The CIM helps you to normalize your data to match a common standard, using the same field names and event tags for equivalent events from different sources or vendors.” This will allow us to build alerts and reports easily after everything is set up.
- TA-pfSense – This allows Splunk to extract fields from pfSense logs.
- Splunk TA for Suricata – This allows Splunk to extract fields from Suricata logs.
Go ahead and download those apps. You’ll need to install them onto your Splunk server and on your pfSense Splunk forwarder, which we’ll set up later in the tutorial.
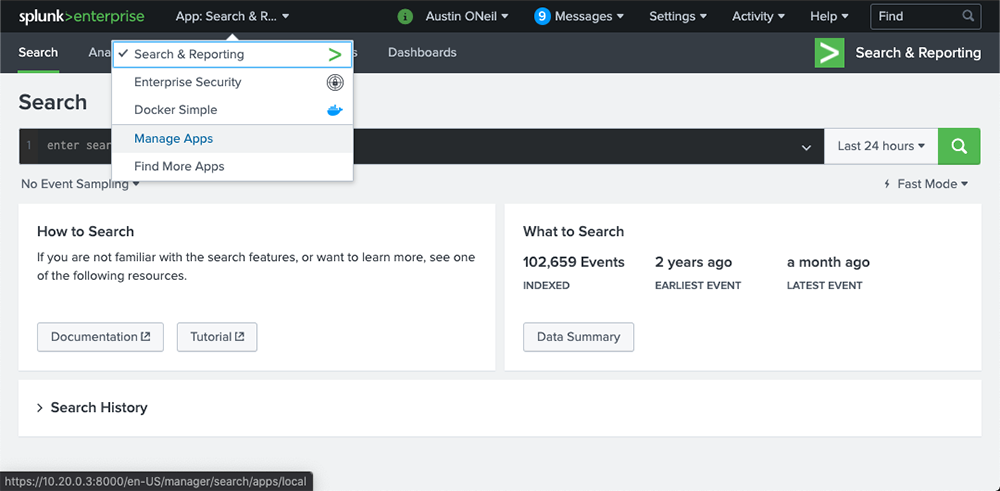
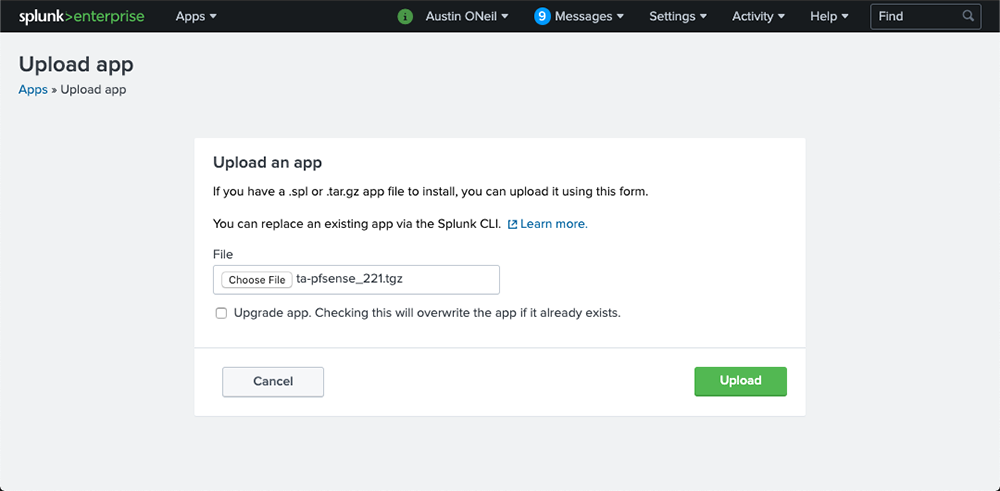
To install the apps on your Splunk server, click Apps > Manage Apps in the top left corner.
We will then want to click “Install app from file” and choose one of the apps you recently downloaded. Once chosen, click “Upload” and repeat until all three apps are uploaded.
We won’t need to configure any of the installed apps. Once all of the apps are uploaded, we can continue to the next step.
Splunk Data Inputs
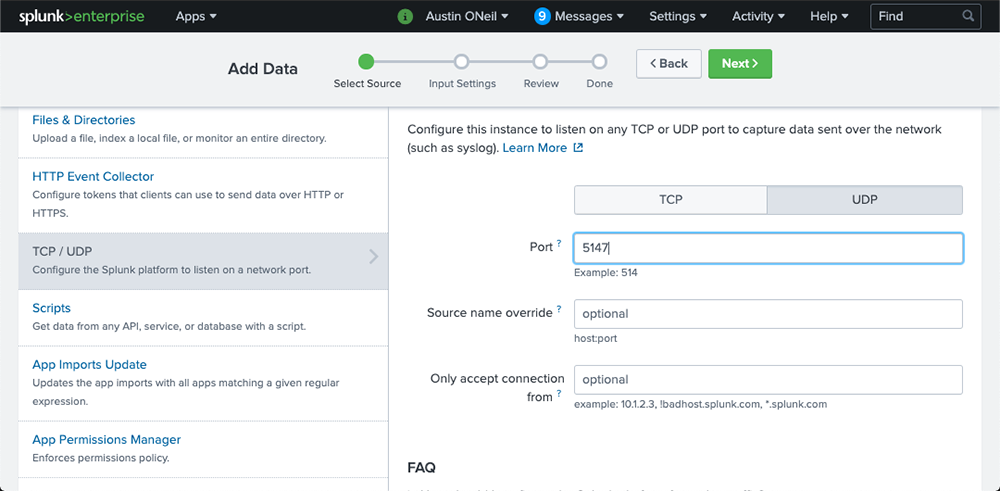
Now that we have the apps installed, we need to configure UDP receiving ports. This can be achieved by going to Settings > Data Inputs. Click “+ Add New” next to UDP. We need to configure a UDP port to receive pfSense logs from the GUI.
We will be taken to the add data page within Splunk. Let’s go ahead and add in a port to receive our logs. I am going to use port 5147.
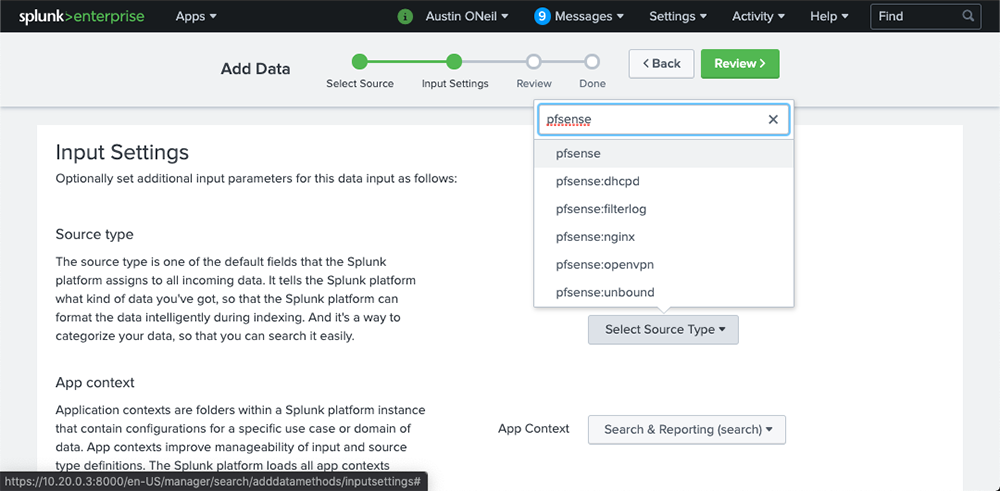
In the source type drop down, type “pfsense”. We need to select pfsense without the “:” as seen in the image below.
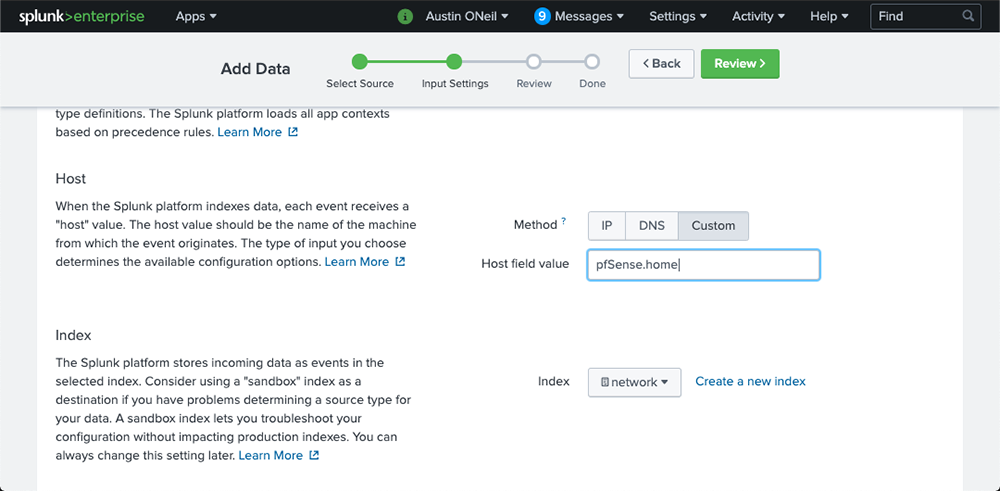
The next setting we need to change is the host field. Select “Custom” and type in the host name of your pfSense router. Once that’s complete, select the index drop down and select the “network” index we created earlier.
Continue to the next page by clicking “Review,” verify your new data input settings, and click “Submit.”
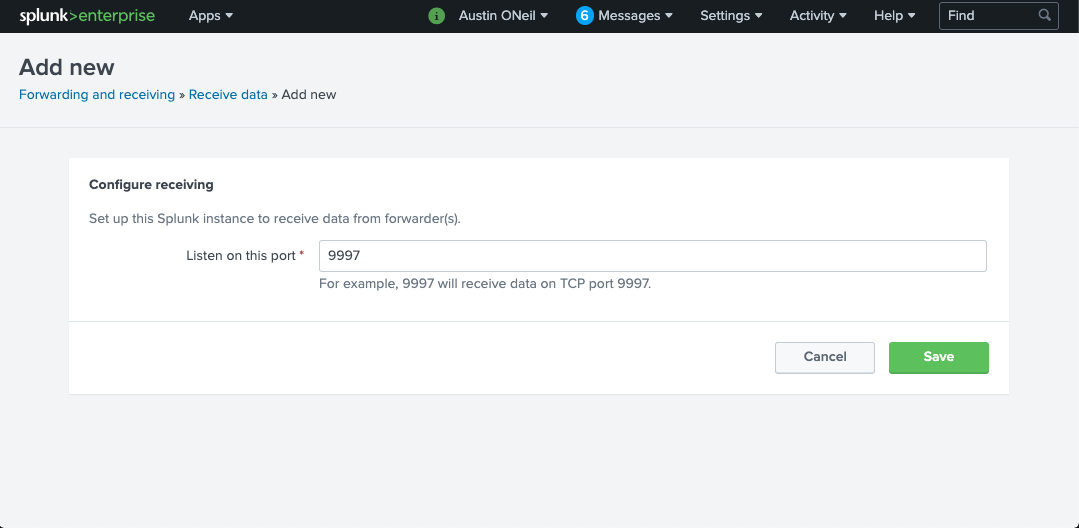
Once that is complete, we need to set up our receiving port for our forwarder. Go to Settings > Forwarding and Receiving. Click “Add New” next to “Configure receiving.” In the “Listen on this port” field, enter “9997.” Once that is done, hit “Save” and then we can go back to the Splunk homepage by clicking on “Splunk>” in the top left corner.
Step 4: pfSense Remote Logging Setup
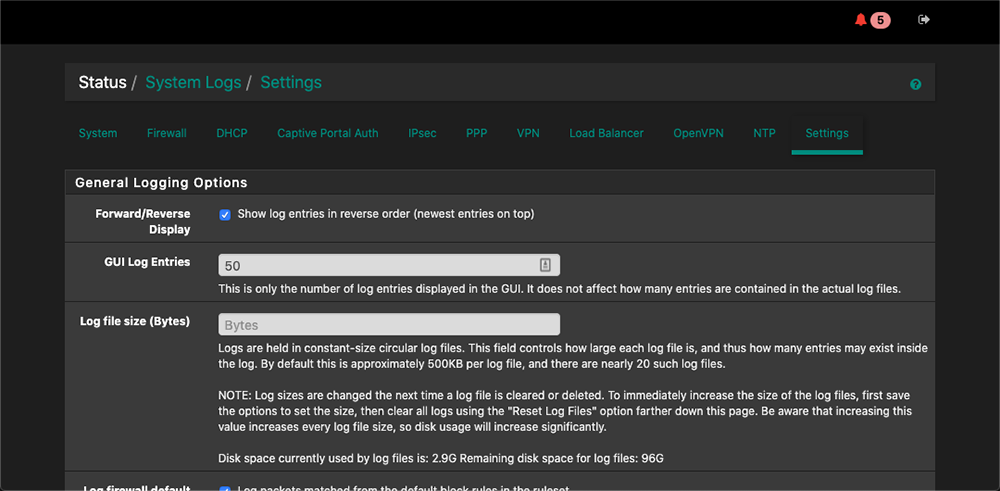
We need to set up pfSense to log to the new index and data input we just set up. To do so, in pfSense’s web GUI go to the NAVbar and select Status > System Logs. Once there, we need to go to the settings tab and scroll down to the bottom of the page.
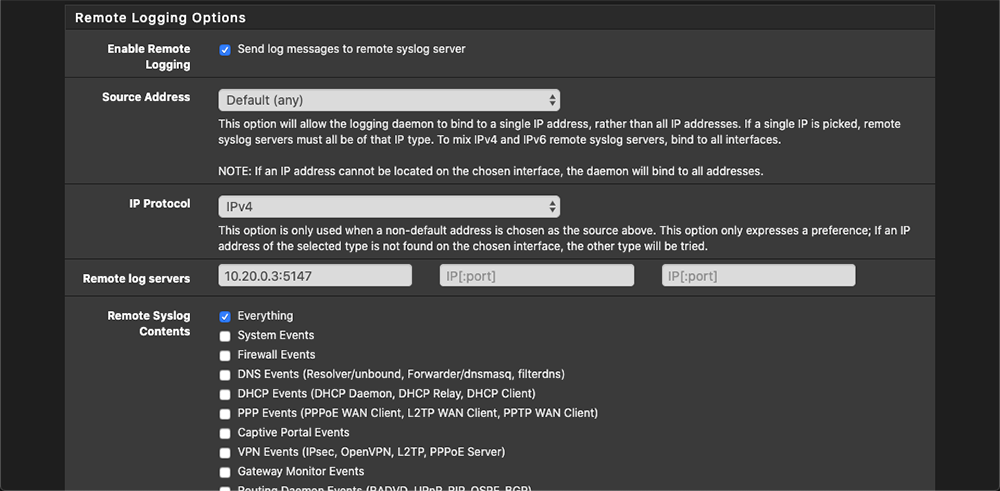
Go ahead and check the “Enable Remote Logging” box. Enter the IP address of your Splunk server followed by the port number we set up in the Data Inputs section. The last thing we need to do is check the “Everything” box under Remote Syslog Contents. Save the page.
At this point, we should be able to go back to our Splunk instance and run the following search.
index=network sourcetype=pfsense*
You should now see pfSense events returning from your Splunk search with all fields from the TA extracted! If you don’t see all fields being extracted, be sure to run the search in “Verbose Mode.”

Step 5: Configuring pfSense Suricata
Okay, we have pfSense logs inside Splunk. Now we need to get our IDS setup and then get the logs shipped to Splunk. Let’s get started! Since we installed Suricata in a past step, we just need to configure it.
Let’s go to Services > Suricata inside of pfSense. We first need to go to the Global Settings tab and enable rules to download. Since free is good enough for my environment, I enabled ETOpen Emerging Threats and I set up a Snort account to download the free community Snort rules. You can sign up for an account here.
You can change the update interval to automatically download the new rules added to ETOpen and Snort Community rule base.

Next, we want to go to the “Updates” tab and hit “Force” to force download all the rules we selected on the previous page.
Once that is done, we can return to the Interfaces tab and click the “+ Add” button to set up the WAN interface. There will be a few screenshots below–these are what I determined to give the best logging output. We need Suricata to log in EVE JSON mode.

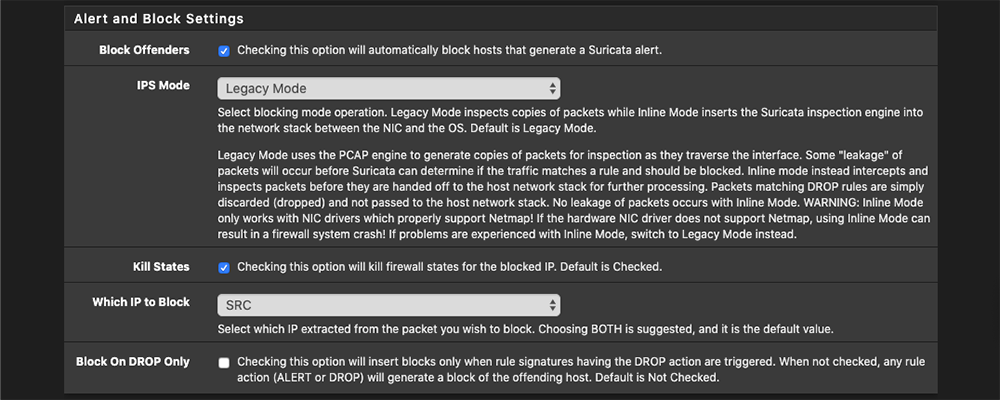
We now have to determine if we want to block offenders or not. You have the option to pick between legacy mode or inline mode. I recommend checking out this blog post on Netgate’s forums to determine what would be the best option in your use case scenario. I selected Legacy for my use case. Go ahead and hit save.
Next let’s go to the Categories tab and select the rule sets you want to enable.

Finally, let’s go back to the interfaces tab and hit the green arrow next to WAN. This should enable Suricata.
Step 6: pfSense Splunk Forwarder and Shipping of Suricata logs
We’re in the home stretch!
In order to ship the Suricata logs to our Splunk server, we need to install a Splunk forwarder. Since pfSense is FreeBSD, we need the Splunk Universal FreeBSD forwarder found here. Once that is downloaded, I found the easiest way to get it on pfSense is to unzip the .txz file and then SCP the folder to pfsense.
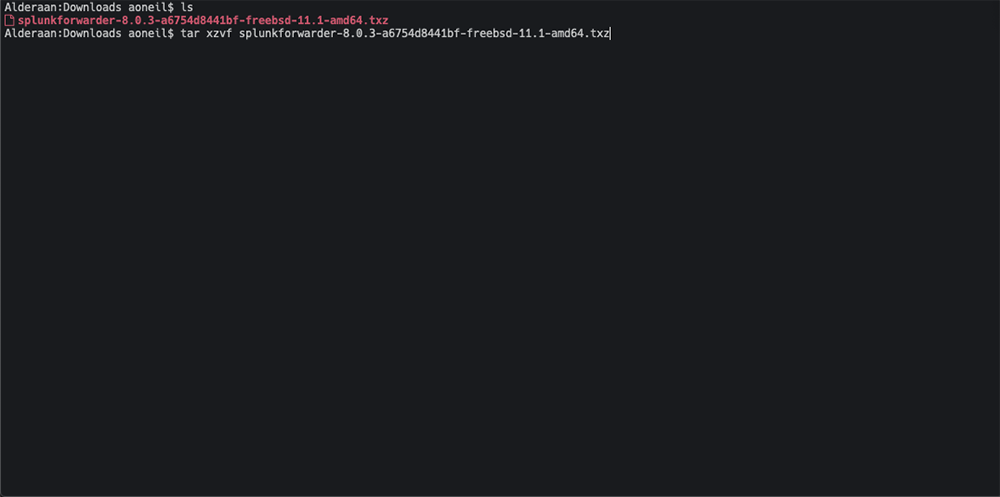
If you’re on Mac or Linux, to extract the .txz file, run the following command:
tar xzvf splunkforwarder-8.0.3-a6754d8441bf-freebsd-11.1-amd64.txz
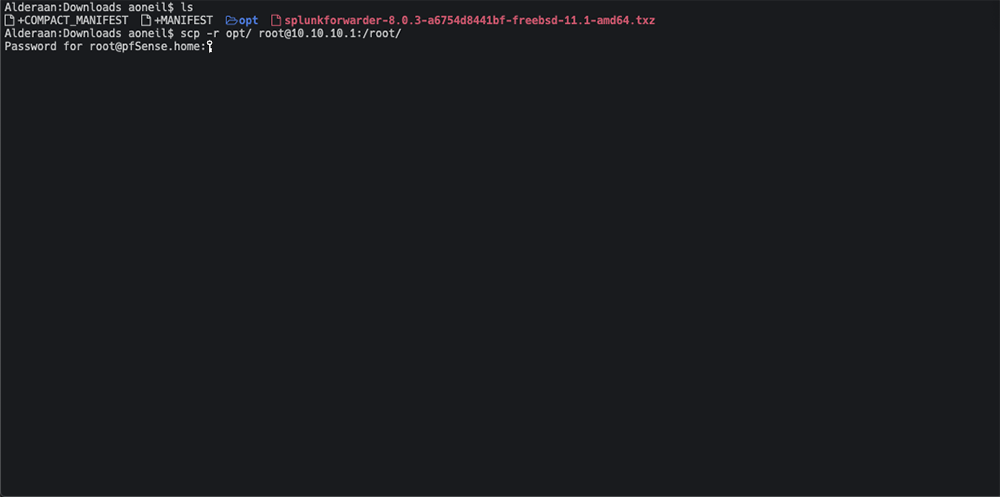
We will be left with a few files in the directory that we unzipped the folder into. Next, we will want to scp (copy the files over SSH) the folder to our pfSense router using the following command:
scp -r opt/ root@ip-of-pfsense:/root/
While we’re at it, let’s unzip the Suricata TA that we downloaded earlier and scp the folder to the router as well with the following commands:
tar xzvf splunk-ta-for-suricata_233.tgz
scp -r TA-Suricata/ root@ip-of-pfsense:/root/
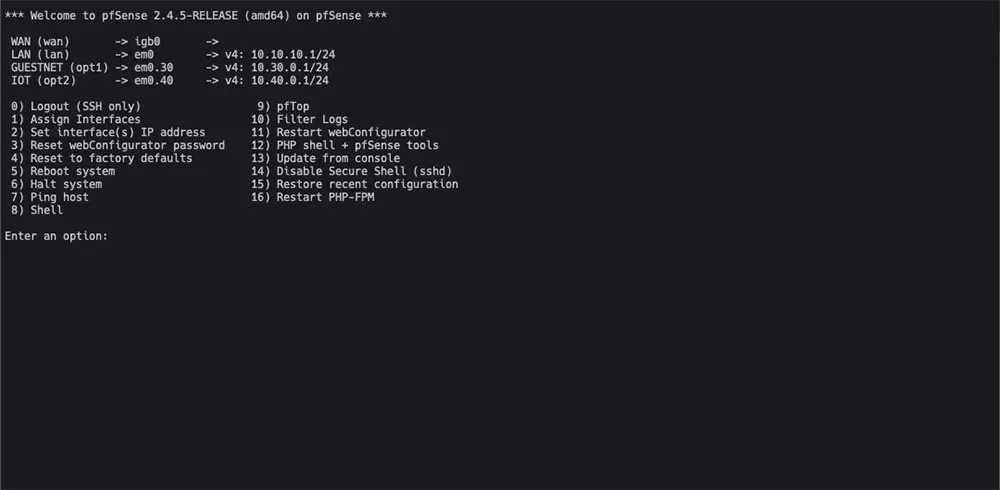
Having done that, we can SSH back into the router and hit option “8” for Shell. When we choose option 8, it should put us into the /root/ directory. From here, we can run an “ls” command to verify that the scp commands were successful. You should see an “opt” and “TA-Suricata” folder in /root/.
1.) Let’s go ahead and move the opt folder to the / directory by issuing the command:
mv opt/ /
2.) Next we need to move the TA-Suricata folder to the apps folder using the following command:
mv TA-Suricata /opt/splunkforwarder/etc/apps
3.) Now that we have the opt directory moved and the Suricata TA in the apps folder, let’s go to the Splunk forwarder folder and configure our outputs.
cd /opt/splunkforwarder/etc/system/local
4.) The outputs.conf file tells the Splunk forwarder where to send the data to.
If there isn’t a outputs.conf file in the folder, let’s create one with the following content.
Side note: pfSense’s only text editor is Vi. Yes, I know. I’m sorry… This won’t be the time or place to discuss text editors, but If you need help in Vi, there are countless guides online.
[tcpout]
defaultGroup=my_indexers

[tcpout:my_indexers]
server=ip-of-splunk-server:9997
5.) Next, let’s configure the Suricata TA to monitor our Suricata Eve JSON log we set up earlier.
6.) We need to change directories to our TA-Suricata folder.
cd /opt/splunkforwarder/etc/apps/TA-Suricata/default
7.) Note what folder name Suricata is logging to. We can do so by ls-ing the log folder for Suricata.
ls /var/log/suricata/

Keep note of the folder names! In my case, I have two Suricata folders inside of my Suricata log folder as I am using suricata on two interfaces. In your case, you may only have one.
8.) We will now need to make/edit our inputs.conf file inside of /opt/splunkforwarder/etc/apps/TA-Suricata/default.
9.) Open Vi and make the following edit:
[monitor:///var/log/suricata/suricata_interface_from_previous_ls_command/eve.json]
sourcetype=suricata
index=ids
host=pfSense.home
10.) Finally, we just need to start the Splunk Forwarder. Let’s change directories to the Splunk bin folder:
cd /opt/splunkforwarder/bin
11.) To set Splunk to start on bootup of pfSense, run:
./splunk enable boot-start
12.) To start Splunk run:
./splunk start
Let’s check out our new logs in Splunk!
index=ids sourcetype=suricata*

Great! As you can see, we are now receiving extracted Suricata logs being returned from our search. Since we installed the CIM app, we can do stuff like tag=dns and receive back DNS logs and so forth. Again, if you don’t see all interesting fields on the left, be sure to run your search in “Verbose” mode.
Wrapping It Up
Pat yourself on the back and grab yourself a reward (I prefer pizza); you did it!
Where do you go from here? Well, now that you have these logs and the data is normalized, you can start building out alerts, reports, and beautiful dashboards around your newly imported data. This is just the beginning my friend.
I sure hope this guide has been helpful. If you still need a hand, I recommend checking out these resources: